Reshaping the agency experience for performance insights
Context
Campaign Monitor's agency account allows administrators to manage clients and campaigns from a dedicated admin area. However, without a consolidated view or aggregated metrics to provide a performance overview and help them to identify high-performing clients and those who needed attention, account management was slow and reactive, preventing agencies from offering tailored solutions, identifying opportunities and demonstrating value, directly impacting client retention and business growth.
How might we deliver a comprehensive suite of metrics, at both the client and account level, that helps agencies measure, understand, and monitor performance in one place?

Research
Administrator roles varied significantly
Roles ranged from strategic to operational, each with different data needs. The same platform was being used in different ways, even within a single team. A fixed, one-size-fits-all view wouldn't work; flexibility and customisation were essential.
Not every metric mattered to every account
Agencies prioritised different metrics based on their business models. For some, volume metrics directly influenced billing and revenue; for others, engagement metrics were the primary measure of success. Designing for the average user wasn't going to work; context-specific insights were critical.
Existing experience wasn't meeting the expectation
The available data was fragmented and hard to act on. The activity feed was limited and didn't fit the purpose. Clients would rely on The Client Compass, a monthly email sent with summarised account performance from the month before. Teams had developed workarounds just to track basic performance, showing a clear gap between user needs and platform capabilities.

Key Interface Decisions
A dashboard built around agency-level metrics
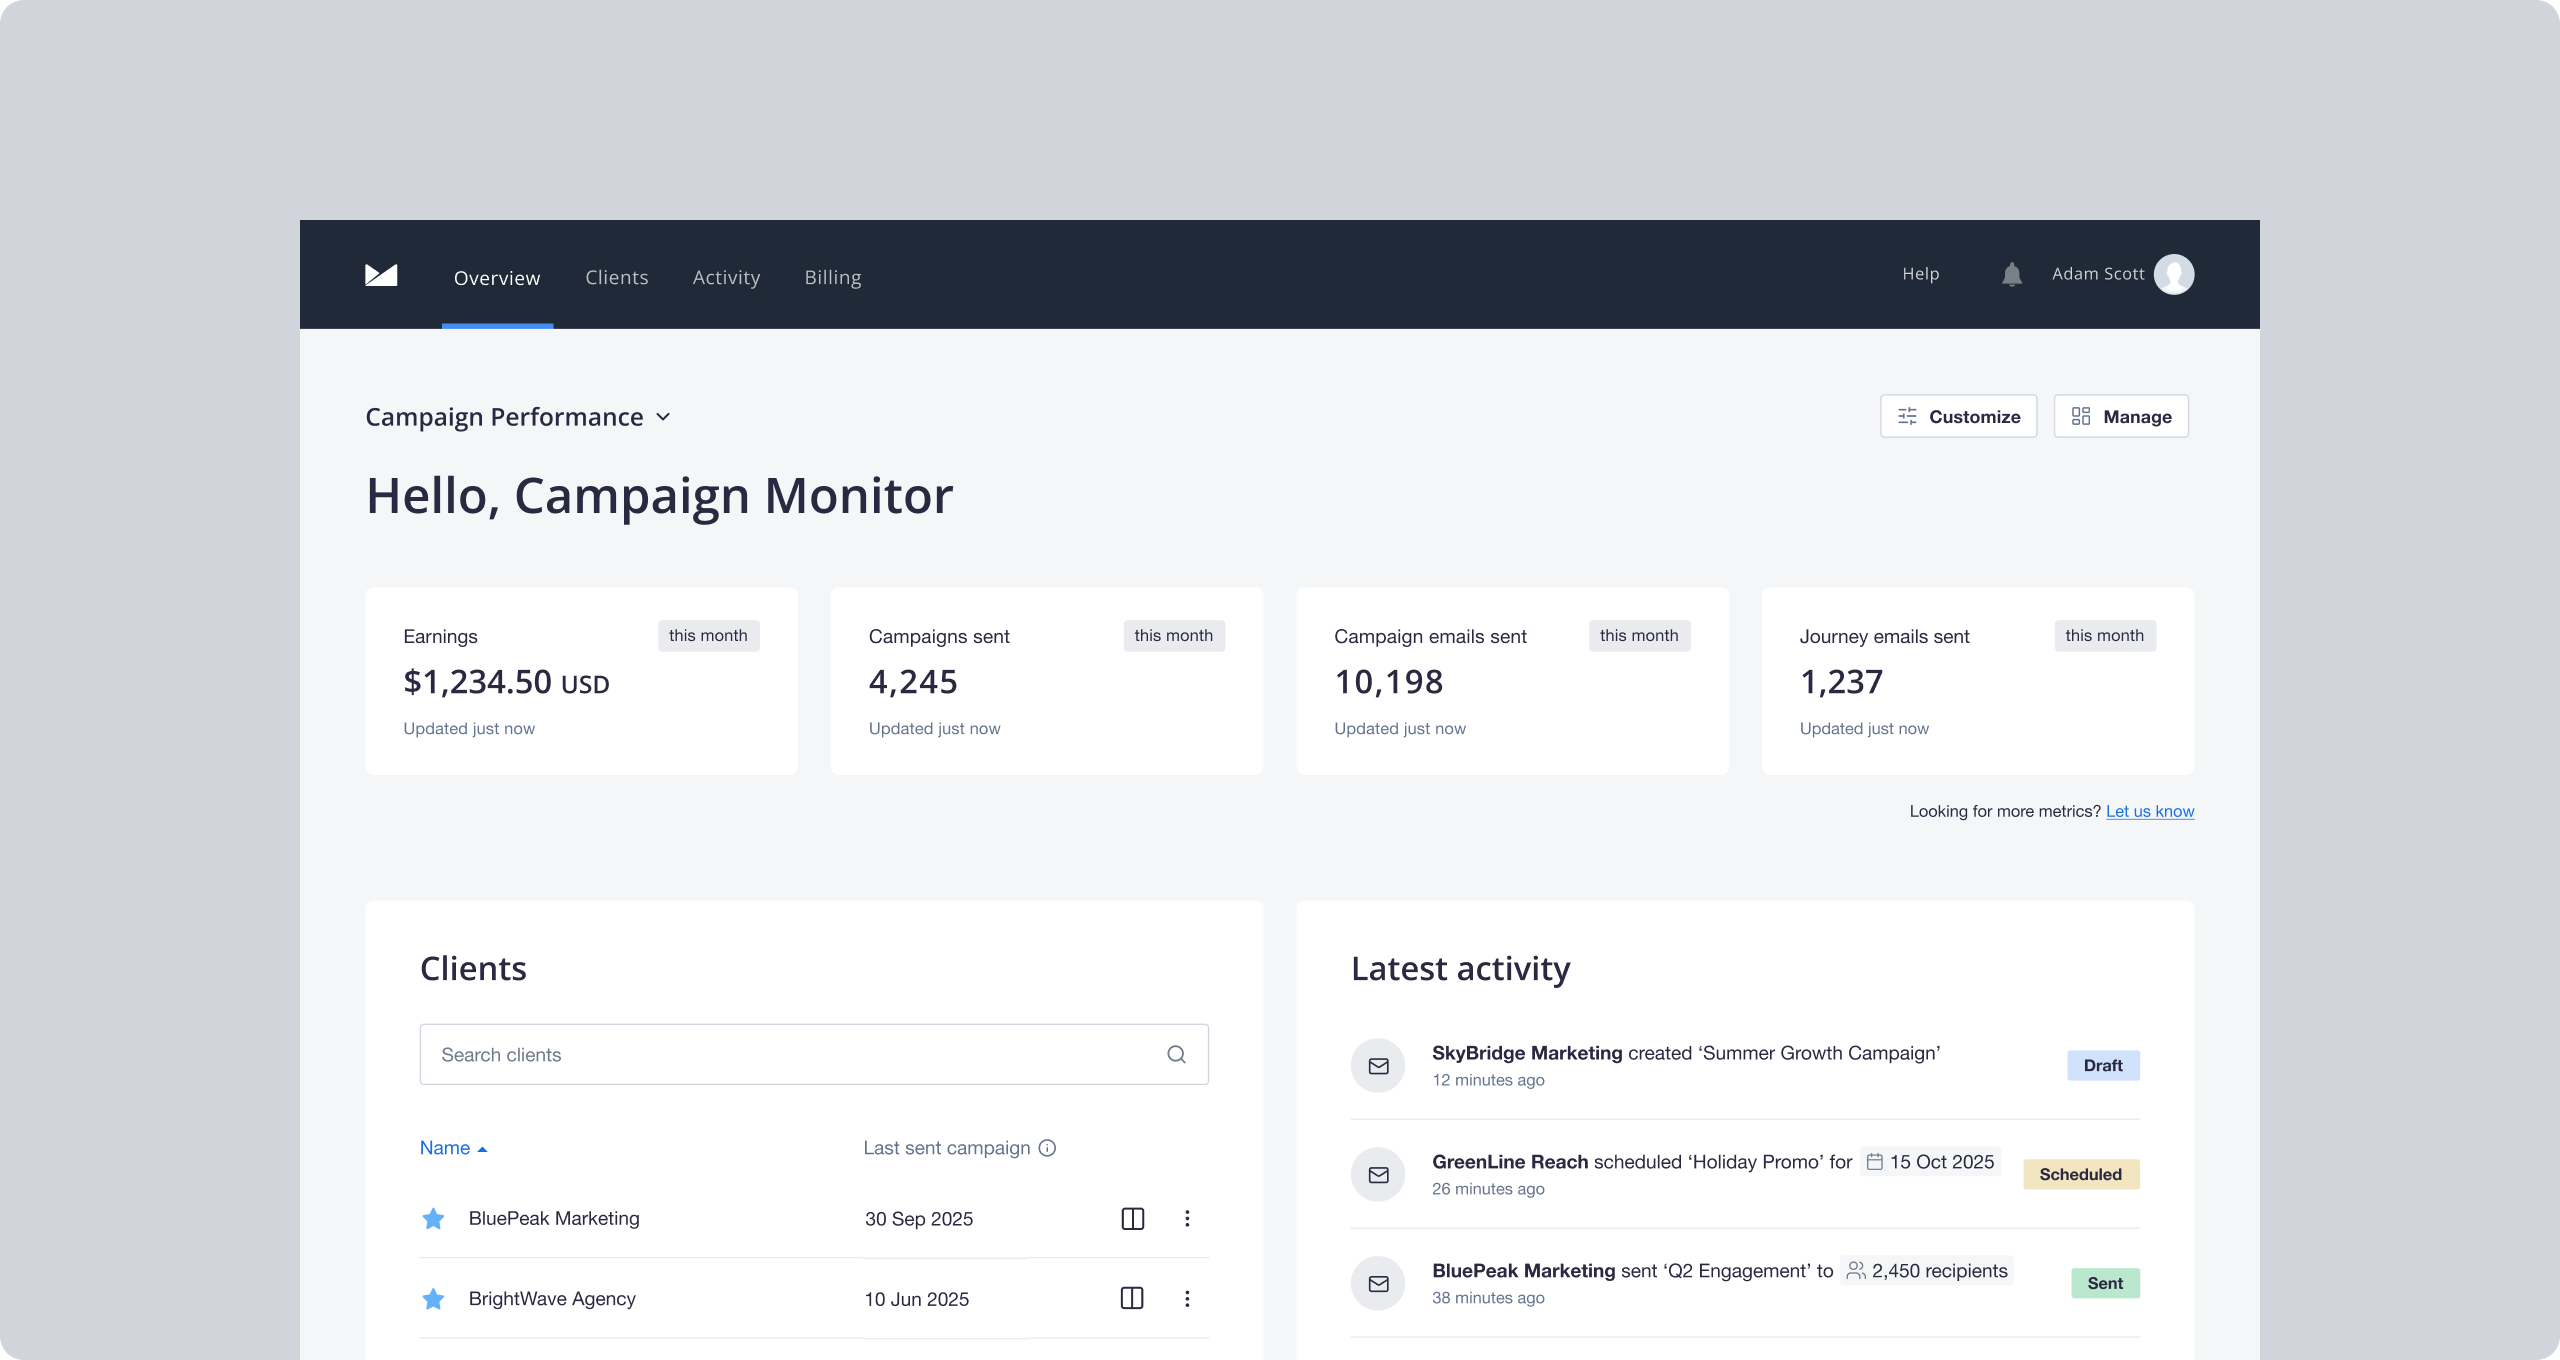
Agency-level metrics didn't exist anywhere in the platform and administrators could only see client performance, one account at a time. The new dashboard surfaces agency-level metrics at a glance, prioritising the numbers that let administrators analyse how they are doing the moment they log in.
Detailed views without leaving the admin area
Agency and client-level metrics detailed views were introduced and made accessible directly from the dashboard, one click away, removing the need to leave the admin area entirely.
Dedicated Clients and Activity pages
Clients and Activity existed only as limited sections on the default page. I moved both into dedicated pages with filtering and additional capabilities, giving administrators a proper view for tracking clients and monitoring activity directly within the platform.
Customisable, multi-dashboard views
Research showed the same platform was being used differently depending on role and business model. I gave administrators the ability to customise their view and create multiple dashboards, allowing a billing-focused agency and an engagement-focused agency to each configure something that matched how they worked.
A feedback widget across key areas
With customers spread across timezones, scheduled sessions alone became unsustainable. I added a feedback widget directly into the interface, letting us validate the direction and adjust course without slowing delivery.


Impact
Replaced a manual workflow at scale
Eliminated the need for 4,000+ agencies to check performance account by account, removing a process customers had described as "time-consuming and painful."
Consolidated 30+ metrics into one view
Administrators can now see client and agency-level performance together for the first time, in a single, real-time dashboard, replacing not just manual checks but The Client Compass, a monthly email that was already a month out of date.
Reduced time spent monitoring performance
78% reduction in time administrators spent checking client performance, freeing them up for higher-value account management.
Surfaced high and underperforming clients at a glance
With client and agency-level metrics available together, administrators could spot who needed attention faster, enabling more targeted action instead of reactive account management.
Delivered on a strategic initiative
The redesign supported a company-wide push to grow the agency segment, a customer base directly tied to retention and revenue.